Xdebug helper
- 类型:拨号工具
- 大小:0.07M
- 平台:WinAll
- 语言:简体中文
- 版本:1.6.1
- 时间:2022-09-06 18:15

Xdebug helper最新版是一款可以与Zend Studio、WAMPSERVER协同工作的PHP chrome调试插件,Xdebug helperc:php调试插件是PHP CHROME调试插件,Xdebug helper正式版能够帮助用户调试、分析和扩展Xdebug跟踪,还可以与Zend Studio、WAMPSERVER协同工作。

Xdebug helper开发背景
Xdebug helperc:php调试插件正式版是一款与Zend Studio、WAMPSERVER协同工作的PHP chrome调试插件。做php开发都会用xdebug,但是自从安装了xdebug后,发现每次调试都需要从eclipse中先从头启动,然后一步步走到你要调试的页面,而不是说想什么时候调试就什么时候调试。之前用zenddebugger的时候则是可以在任意页面启动调试,直接从浏览器通知开发环境需要调试。而不用先从开发环境启动调试。随时需要调试的时候就可以执行调试。这个时候就需要一款chrome浏览器有一款插件叫xdebug helper。此扩展对于PHP开发人员非常有用,PHP开发人员使用带有Xdebug支持的PHP工具,如PHPStorm,Eclipse with PDT,Netbeans和MacGDBp或任何其他Xdebug兼容性分析工具,如KCacheGrind,WinCacheGrind或Webgrind。默认情况下,扩展程序图标将显示在所有页面上,但要尽可能保持浏览器清洁,可以将扩展程序配置为仅在设置面板中显示您想要的页面。
Xdebug helper安装方法
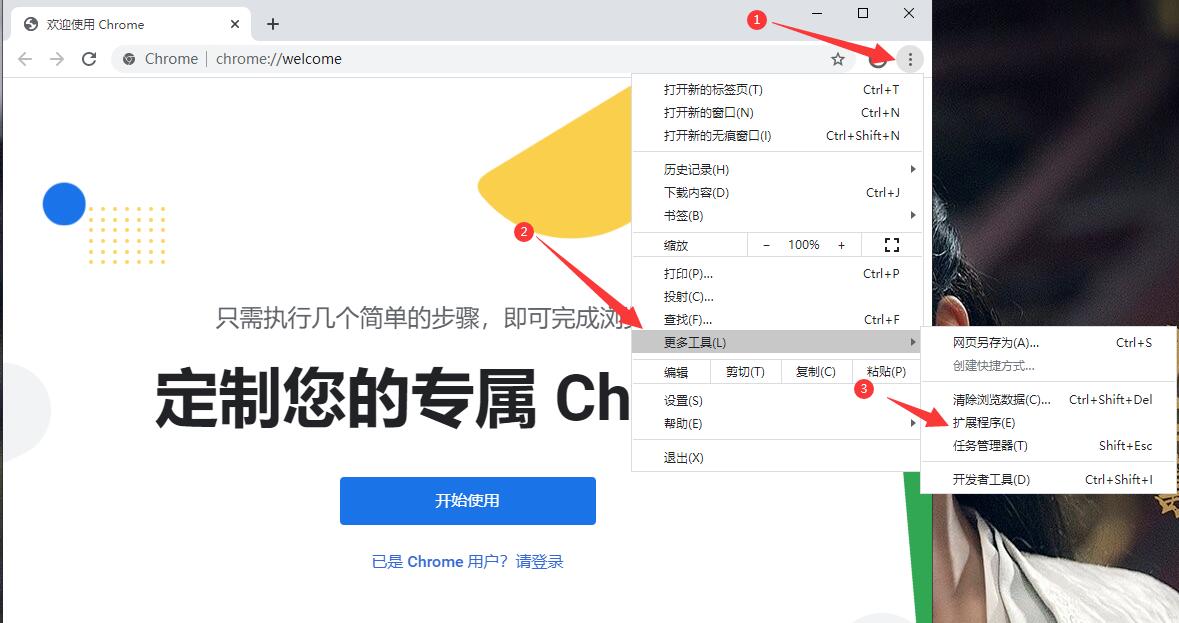
1.首先用户点击浏览器右上角的自定义及控制按钮,在下拉框中选择更多工具选项,然后点击扩展程序来进入Chrome浏览器的扩展管理器页面。
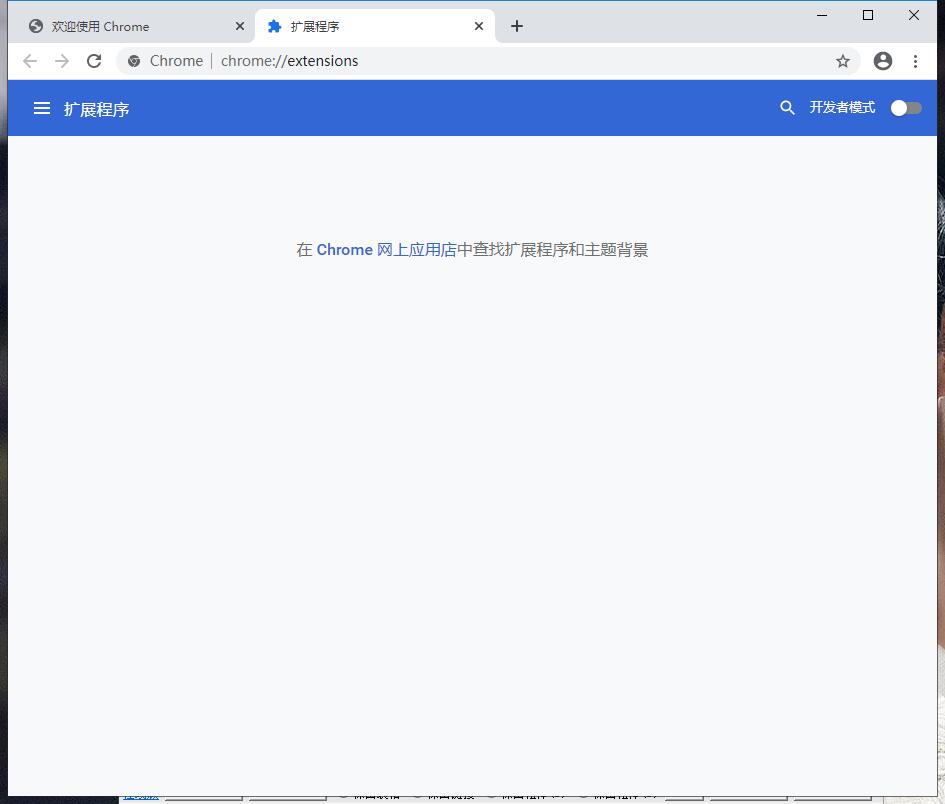
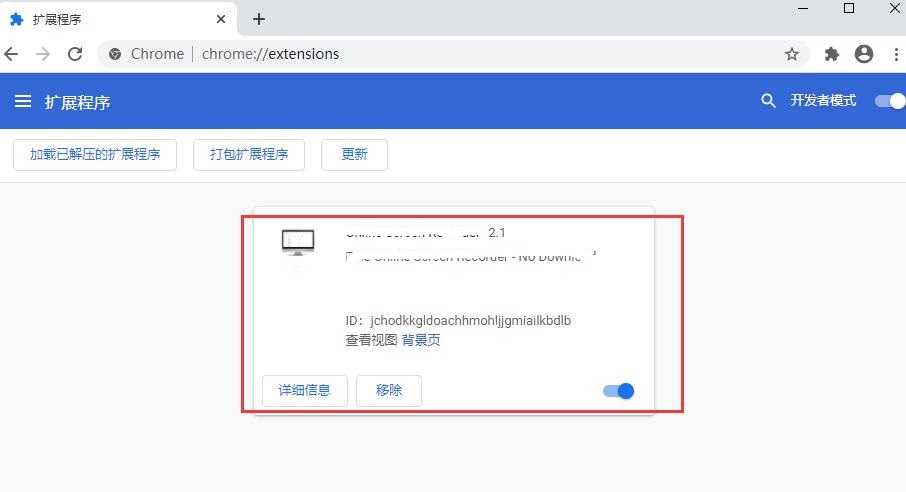
2.在打开的谷歌浏览器的扩展管理器中用户可以看到一些已经安装程序的Chrome插件,或者一个Chrome插件也没有。
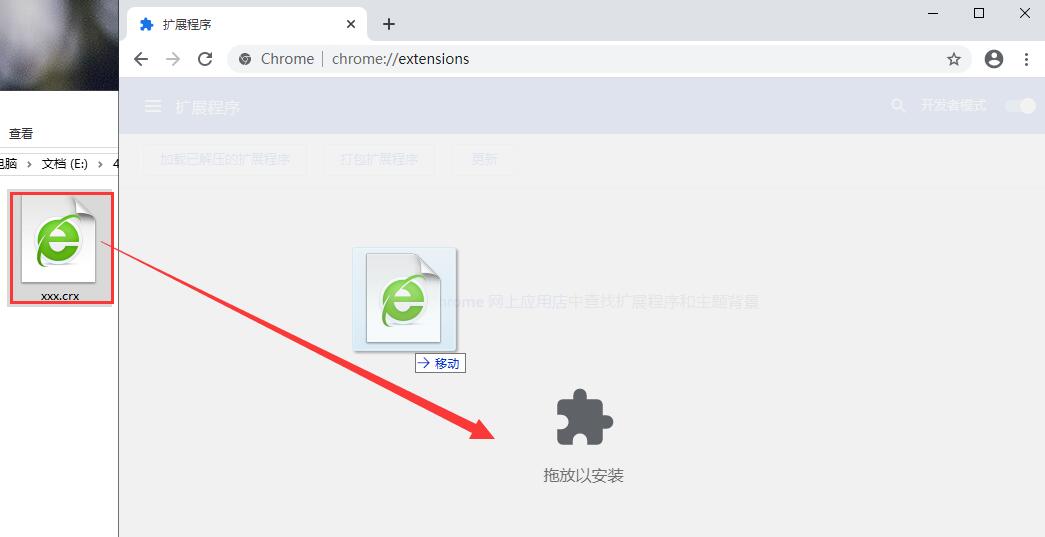
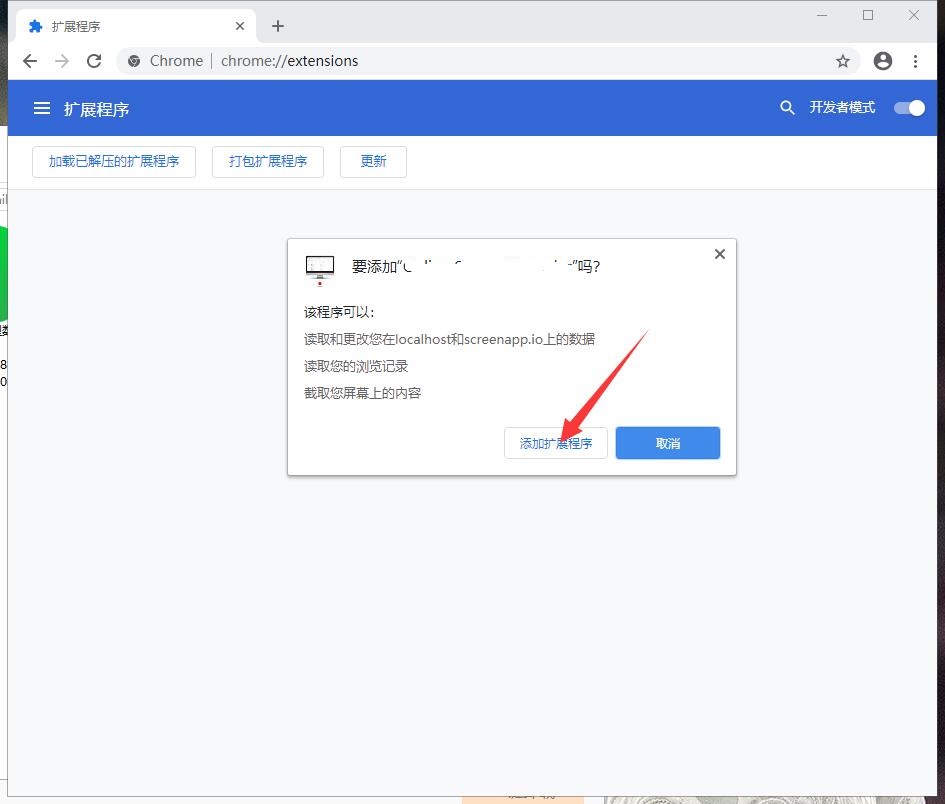
3.找到自己已经下载好的Chrome离线安装文件xxx.crx,然后将其从资源管理器中拖动到Chrome的扩展管理界面中,这时候浏览器会提示要“添加xxx“吗?我们点击”添加扩展程序“即可成功安装插件。
4.显示已经成功安装插件,点击”移除“即可卸载,相当的简便。
Xdebug helper使用说明
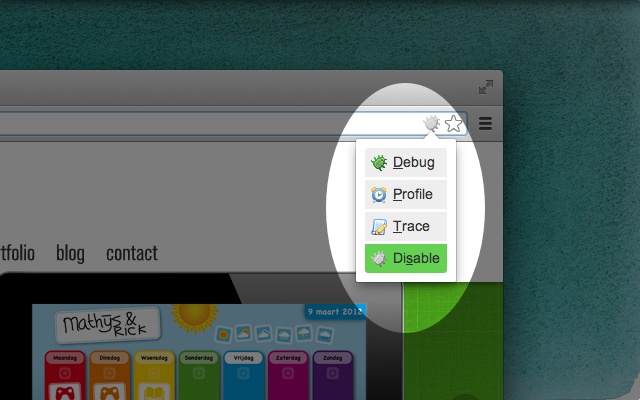
1.安装完成xdebug helper后再浏览器地址栏的右侧能够看到一只小爬虫,点击后如下图所示:

2.选择Debug,就会通知你的开发环境接下来的代码需要开始调试,选择disable,就会直接运行。如下图所示:
3.在xdebug helper中配置它,选择phpstorm并且在右边的框中填入PHPSTORM。
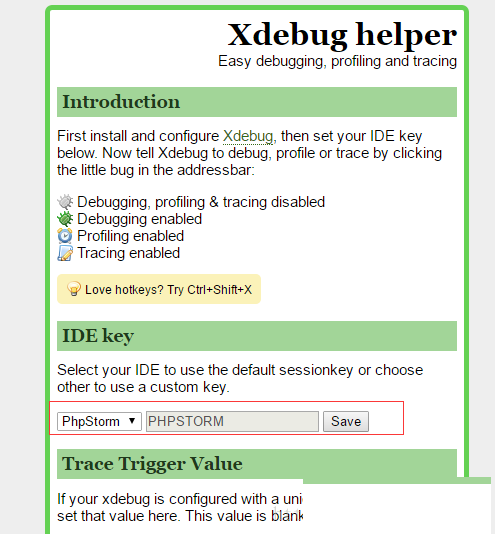
4.到这里所有的配置已经完成了,可以phpstorm中设置断点,然后使用浏览器的xdebug helper开启页面调试。

5.xdebug helper常用热键:
- Ctrl + Shift + X(Mac上的Cmd + Shift + X)打开弹出窗口。
- Alt + Shift + X切换调试状态。
Xdebug helper更新日志
1. 优化的脚步从未停止!
2. 更多小惊喜等你来发现~
硕网推荐
Xdebug helper太好用了,在网络辅助里面算是数一数二的软件,相信用过的小伙伴都会说好用的,如果不喜欢我们还有{recommendWords}

-
天翼飞young校园客户端

版本:5.04
大小:9.77M
日期:2022-09-06
-
SC掌上大学PC端

版本:3.10
大小:7.1M
日期:2022-09-06
-
夸克网盘

版本:2.2.3
大小:64.8M
日期:2023-01-26
-
网盘直链解析

版本:2.4
大小:0.26M
日期:2022-09-06
-
天翼校园客户端(旧版支持wifi共享)

版本:v1.3
大小:10.3M
日期:2022-09-06
-
百度识图器

版本:1.0
大小:0.12M
日期:2022-09-06
-
WishRecy 4.07 绿色免费版

版本:4.07
大小:9.07M
日期:2022-09-07
-
飞秋 V1.0 免费安装版

版本:V1.0
大小:7.81MB
日期:2022-09-06
-
WhatsApp

版本:v1.0
大小:134.63MB
日期:2022-09-06
-
苹果录屏大师AirPlayer 1.1.0 官方安装版

版本:1.1.0
大小:7.268M
日期:2022-09-07
-
黄鹂鸟

版本:1.02
大小:23.65M
日期:2022-09-06
-
HedEx Lite(华为电子文档浏览器) V2.0.0 绿色免费版

版本:2.0.0
大小:6.4M
日期:2022-09-07
-
轻搜跨境浏览器

版本:v1.0
大小:76.78M
日期:2022-09-06
-
雷兔跨境浏览器 V12.0.1000.16 官方安装版

版本:12.0.1000.16
大小:78.59M
日期:2022-09-06
-
KK加速器

版本:2.4.28.1049
大小:45.4M
日期:2022-09-06
-
疯歌音效平台 V1.01 官方安装版

版本:1.01
大小:112.9M
日期:2022-09-06