在Excel折线图里设置横坐标的简单操作
时间:2022-10-26 13:12
有很多朋友还不会在Excel折线图里设置横坐标的简单操作,而下面就讲解了在Excel折线图里设置横坐标的操作方法,来下文看一看吧。
在Excel折线图里设置横坐标的简单操作

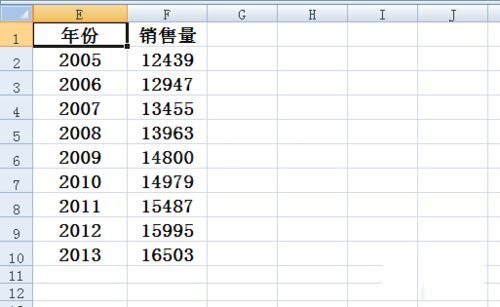
以下面这个年份和销售量的数据为例操作。
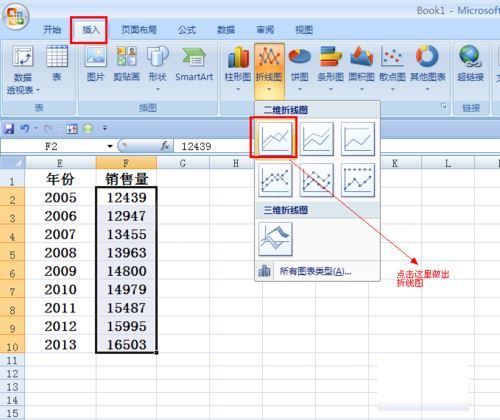
首先选中销售量一列的数据,选择插入,点击折线图。
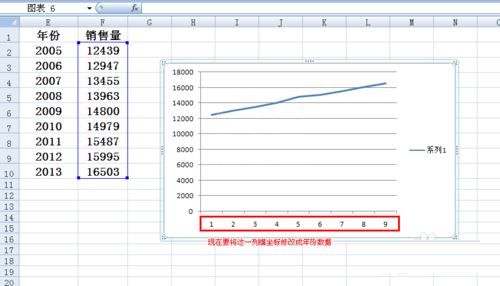
主图做好了,我们要修改的就是下面的横坐。
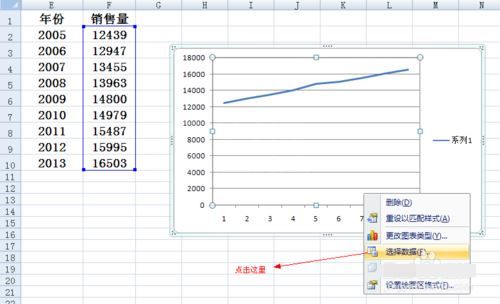
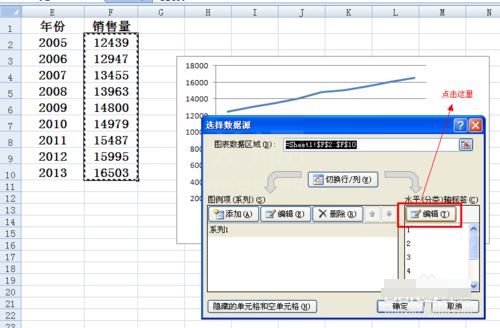
在图上右键单击,在菜单中点击选择数据。
出现选择数据源以后,点击图中所示位置的编辑。
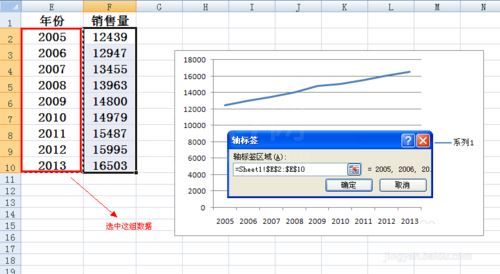
跳出轴标签界面,此时选中年份列中的年份数据,点击确定。
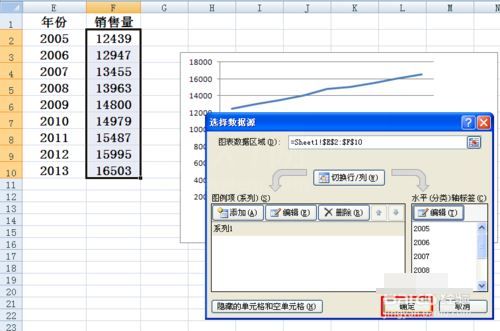
接着在如图所示的位置点击确定。
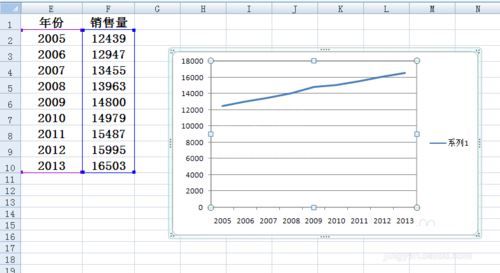
大功告成,折线图的横坐标就设置完成了。
各位小伙伴们,看完上面的精彩内容,都清楚在Excel折线图里设置横坐标的简单操作了吧!


热门排行
今日推荐


热门手游
-
商场购物模拟器官方版

版本:v1.0.9
大小:46.11MB
日期:2024-12-16
-
滚动方块大冒险免费版

版本:v1.0.5
大小:26.10MB
日期:2024-12-16
-
恋恋奇缘体验服版

版本:v1.0.0
大小:131.33MB
日期:2024-12-16
-
炉石传说官方正版

版本:v1.0
大小:100.52MB
日期:2024-12-16
-
人群大师免费版

版本:v2.15.0
大小:57.68MB
日期:2024-12-16
-
方鸡跳跑单机版

版本:v1
大小:63.49MB
日期:2024-12-16