PPT表格平均分布行列的图文操作
时间:2022-10-26 13:51
想知道PPT表格平均分布行列的相关操作吗?下面就是小编整理的PPT表格平均分布行列的图文操作教程,赶紧来看看吧,希望能帮助到大家哦!
PPT表格平均分布行列的图文操作

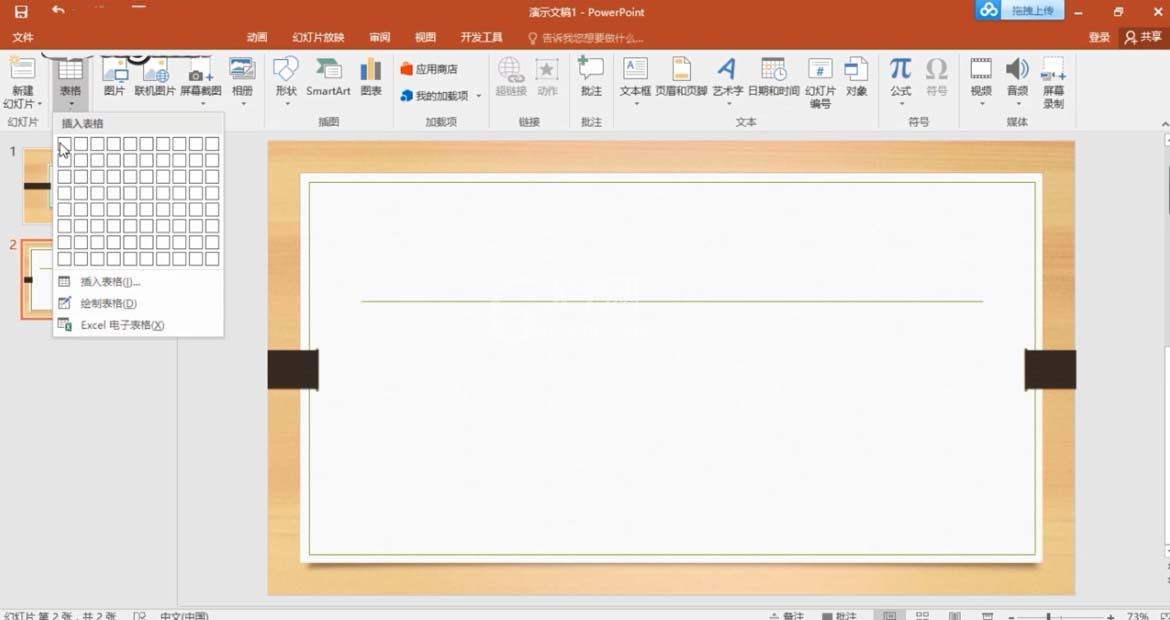
1、 点击菜单栏中的“插入”,点击其中的“表格”,调整行数列数之后插入表格。
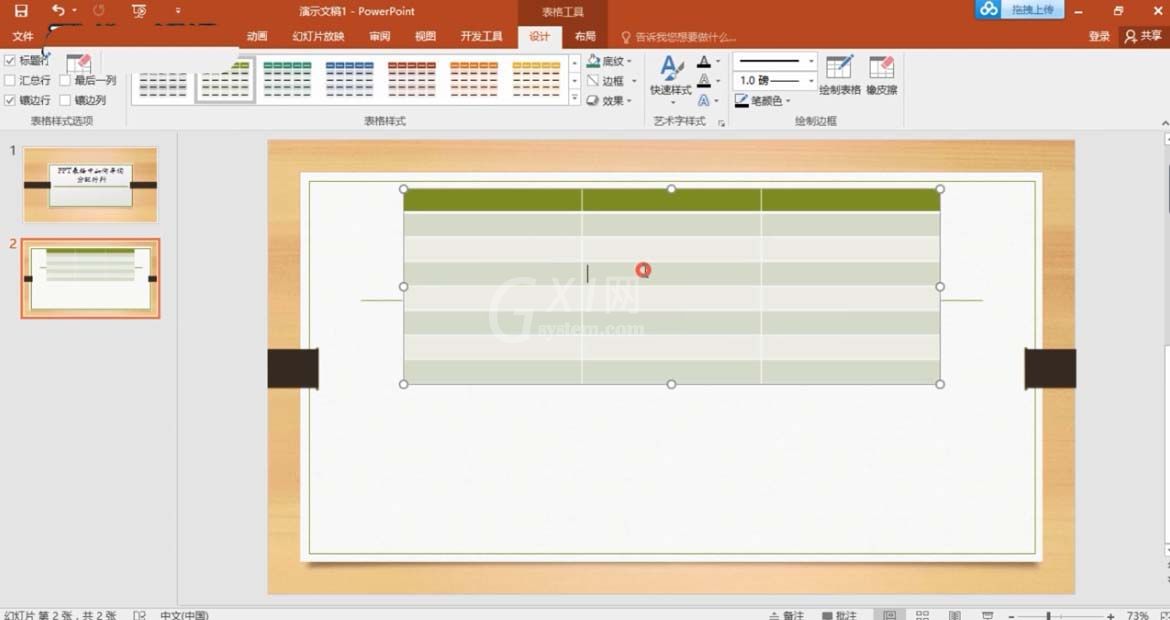
2、 左键单击选中表格。
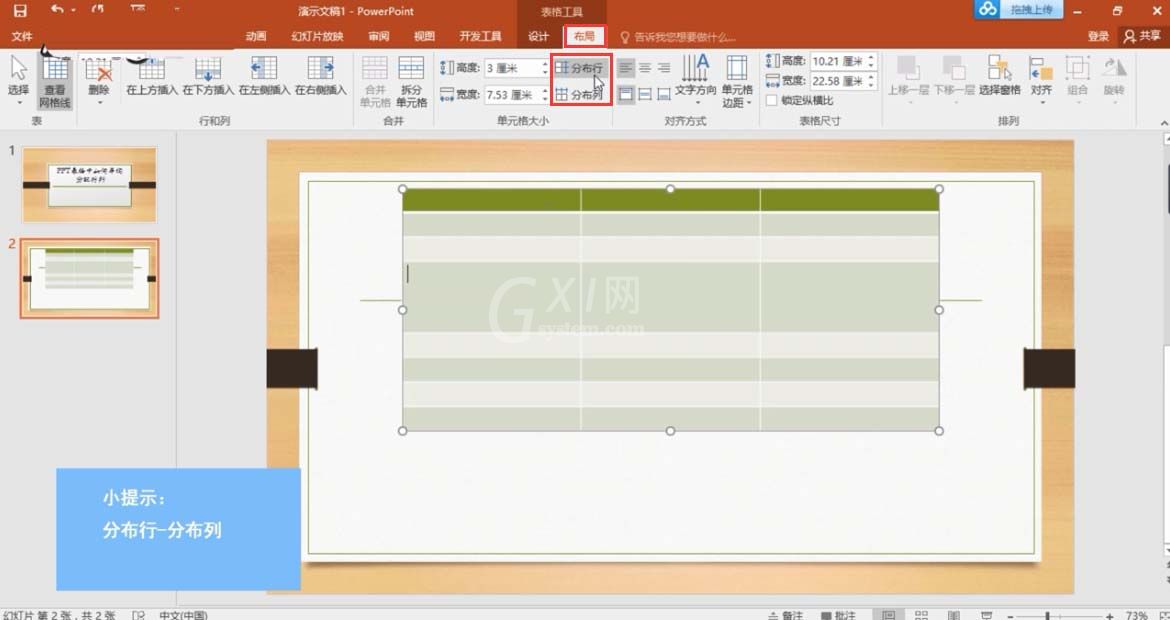
3、 找到“表格工具”下方的“布局”,单击其中的“分布行”以及“分布列”按钮,即可完成平均分配行列了。
以上这里为各位分享了PPT表格平均分布行列的图文操作。有需要的朋友赶快来看看本篇文章吧。


热门排行
今日推荐


热门手游
-
商场购物模拟器官方版

版本:v1.0.9
大小:46.11MB
日期:2024-12-16
-
滚动方块大冒险免费版

版本:v1.0.5
大小:26.10MB
日期:2024-12-16
-
恋恋奇缘体验服版

版本:v1.0.0
大小:131.33MB
日期:2024-12-16
-
炉石传说官方正版

版本:v1.0
大小:100.52MB
日期:2024-12-16
-
人群大师免费版

版本:v2.15.0
大小:57.68MB
日期:2024-12-16
-
方鸡跳跑单机版

版本:v1
大小:63.49MB
日期:2024-12-16