excel2007设置X轴为时间的操作教程
时间:2022-10-26 17:00
我们在使用excel2007的时候,想设置X轴为时间,各位伙伴们知道怎么操作吗?下文这篇教程就为各位带来了excel2007设置X轴为时间的具体解决方法。
excel2007设置X轴为时间的操作教程
我们需要先使用excel2007打开一个带有图表的数据表
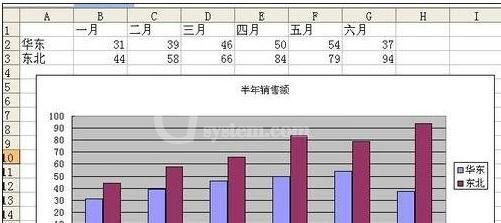
然后我们点击图表区激活图表
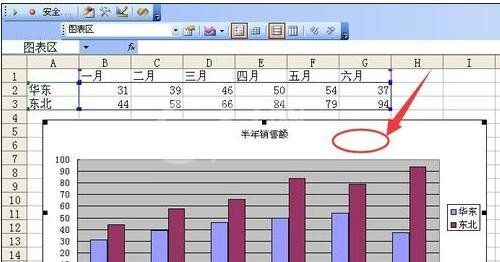
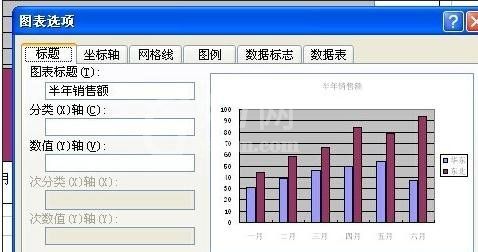
接着点击菜单栏图表图表选项
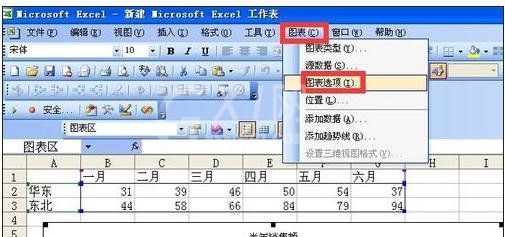
这个时候我们点击完此命令后会弹出图表选项对话框
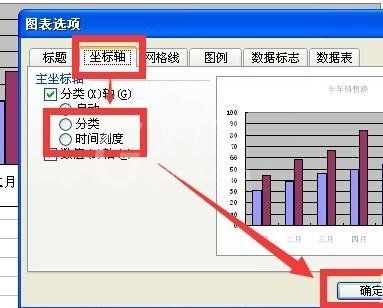
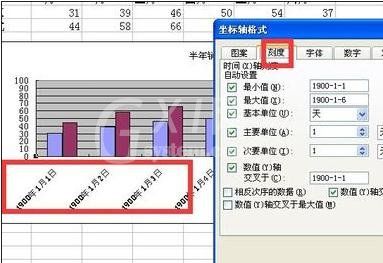
接下来我们点击坐标轴选项卡 然后可以在分类和时间刻度之间切换 然后点击确定 如果选择时间刻度 数据系列(数据源中的一行或者一列数据)的数据点(一个图形对应一个单元格数值)在时间上不连续 图表中会形成空白的数据点 如果要清除这些数据点 可以将时间轴改为分类轴
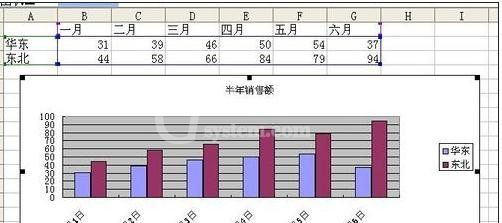
这是时间轴的显示效果
这是分类轴的显示效果
这是分类轴的刻度选项 比较简单只有最大值 最小值 基本单位 主要单位 次要单位 相反次序的数据
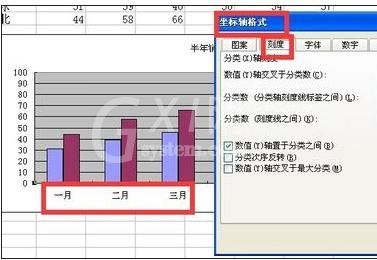
这是时间轴的刻度选项 包括最小值 最大值 基本单位 主要单位 次要单位 数值y轴交叉于 相反次序的数据 数值y轴交叉于日期间 数值y轴交叉于最大值
根据上文为你们讲述的excel2007设置X轴为时间的具体操作方法,你们是不是都明白了呀!


热门排行
今日推荐


热门手游
-
商场购物模拟器官方版

版本:v1.0.9
大小:46.11MB
日期:2024-12-16
-
滚动方块大冒险免费版

版本:v1.0.5
大小:26.10MB
日期:2024-12-16
-
恋恋奇缘体验服版

版本:v1.0.0
大小:131.33MB
日期:2024-12-16
-
炉石传说官方正版

版本:v1.0
大小:100.52MB
日期:2024-12-16
-
人群大师免费版

版本:v2.15.0
大小:57.68MB
日期:2024-12-16
-
方鸡跳跑单机版

版本:v1
大小:63.49MB
日期:2024-12-16