WampServer打开xdebug功能的详细步骤
时间:2022-10-26 17:13
提到WampServer软件,若想打开xdebug功能,应该如何操作呢?接下来请看WampServer打开xdebug功能的详细步骤,希望可以帮到大家。
WampServer打开xdebug功能的详细步骤

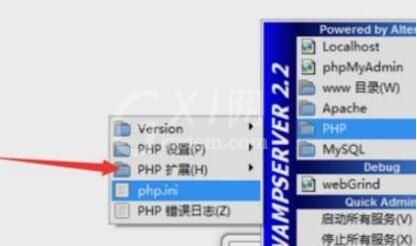
1、弹出了下拉菜单中进行选择为“php设置”的选项
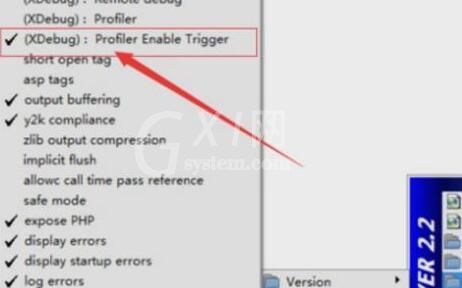
2、进行选择为了php设置之后,就会弹出了一个为进行勾选上(xdebug):profiler enable trigger的选项即可。
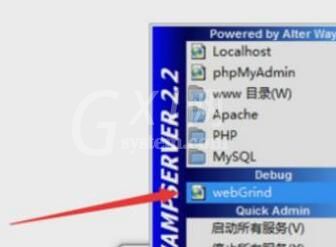
3、然后在次通过的是WampServer的选项,进行选择为webgrind的选项。
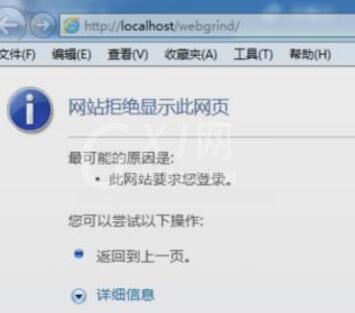
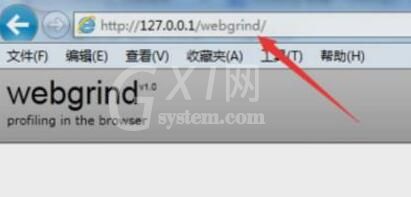
4、然后就会通过网页进行打开了网站xdebug,显示无法打开该网站,进行需要把localhost进行改为127.0.0.1即可。
5、这样就进入到了webgrind的中就可以使用xdebug功能对性能上分析问题
以上就是WampServer打开xdebug功能的详细步骤,大家都学会了吧。


热门排行
今日推荐


热门手游
-
商场购物模拟器官方版

版本:v1.0.9
大小:46.11MB
日期:2024-12-16
-
滚动方块大冒险免费版

版本:v1.0.5
大小:26.10MB
日期:2024-12-16
-
恋恋奇缘体验服版

版本:v1.0.0
大小:131.33MB
日期:2024-12-16
-
炉石传说官方正版

版本:v1.0
大小:100.52MB
日期:2024-12-16
-
人群大师免费版

版本:v2.15.0
大小:57.68MB
日期:2024-12-16
-
方鸡跳跑单机版

版本:v1
大小:63.49MB
日期:2024-12-16