excel2007添加误差线的操作方法
时间:2022-10-26 17:31
一些刚刚下载使用excel2007的朋友们,可能还不是很熟悉excel2007添加误差线的操作方法?下面这篇内容就为你们带来了excel2007添加误差线的操作方法。
excel2007添加误差线的操作方法

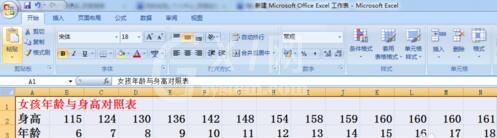
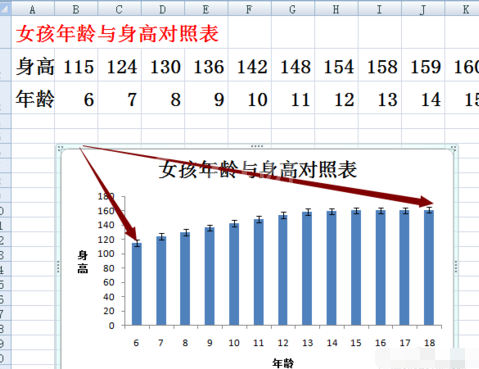
首先打开excel2007。将我们的数据码好。如图
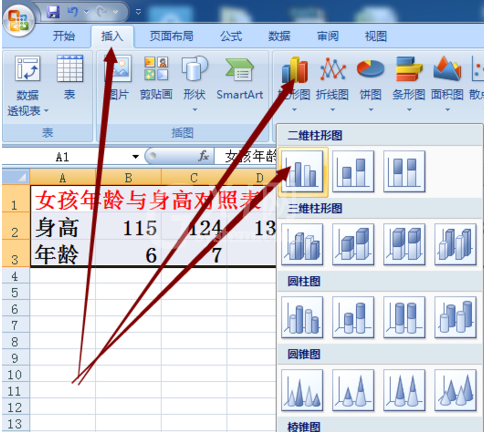
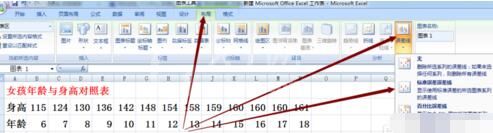
依次选择:插入---柱形图---二维柱形图---簇状柱形图
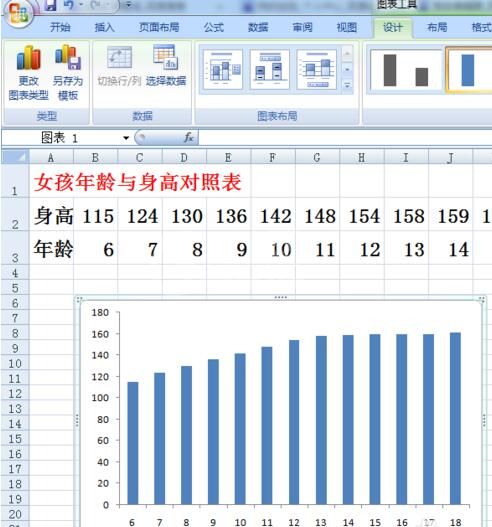
对图表的数据进行选择修改,数据区域,效果如图
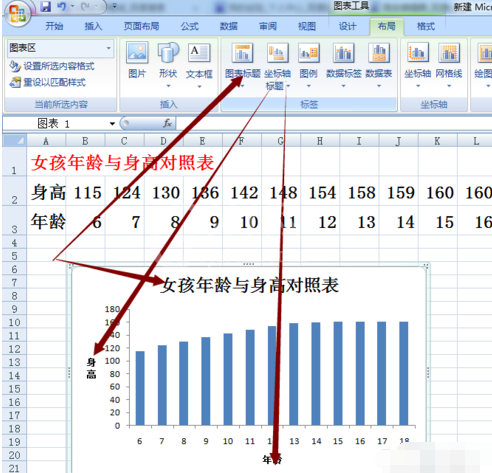
进一步完善图表,添加图表标题,坐标轴标题
下面到最关键一步,添加误差线,那么在07版excel里,这个功能在哪里呢?依次选择:布局---误差线---标准误差误差线
添加后的效果如图,至此大功告成。
今日就快来学习本文excel2007添加误差线的操作过程吧,相信在以后的使用中一定会得心应手的。


热门排行
今日推荐


热门手游
-
商场购物模拟器官方版

版本:v1.0.9
大小:46.11MB
日期:2024-12-16
-
滚动方块大冒险免费版

版本:v1.0.5
大小:26.10MB
日期:2024-12-16
-
恋恋奇缘体验服版

版本:v1.0.0
大小:131.33MB
日期:2024-12-16
-
炉石传说官方正版

版本:v1.0
大小:100.52MB
日期:2024-12-16
-
人群大师免费版

版本:v2.15.0
大小:57.68MB
日期:2024-12-16
-
方鸡跳跑单机版

版本:v1
大小:63.49MB
日期:2024-12-16