excel2010制作扇形图的操作步骤
时间:2022-10-26 17:47
有很多新手小白会被excel2010制作扇形图的问题困惑住,所以小编就带来了excel2010制作扇形图的操作步骤,感兴趣的朋友就跟小编一起来学习一下吧。
excel2010制作扇形图的操作步骤

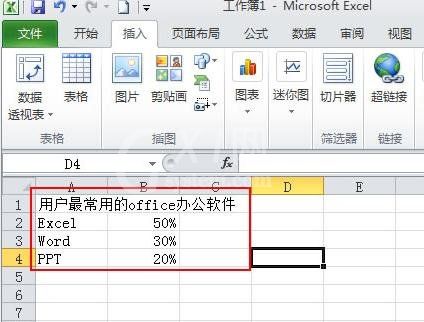
在excel中输入表的名称和数据。
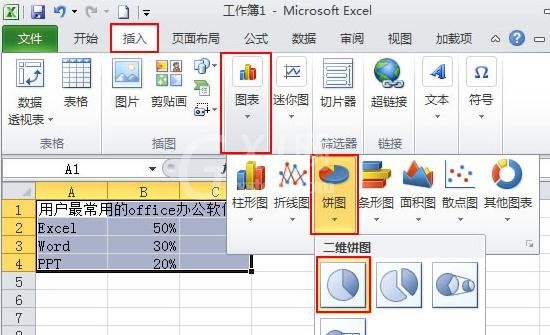
鼠标选中数据表格,切换到【插入】选项卡,单击【图标】选项组,在下拉面板中选择【饼图】—【二维饼图】。
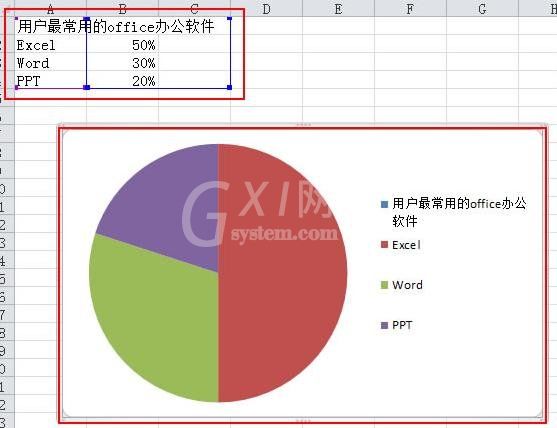
excel系统就自行根据数据建立好了一个饼图。
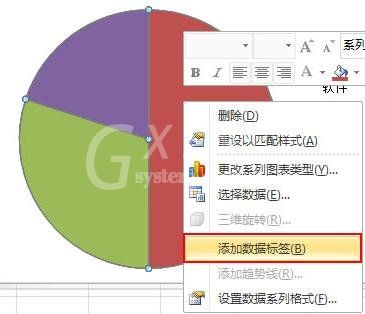
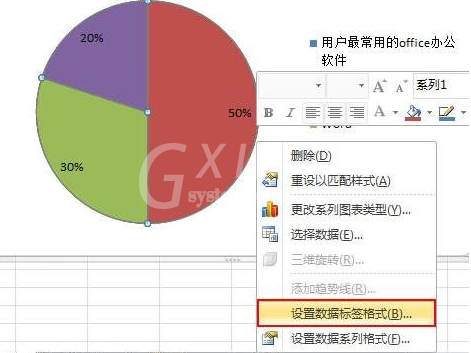
4、给统计图上添加标签文字说明。在饼图上单击鼠标右键,在弹出快捷菜单中选择【添加数据标签】。
这里会发现图上添加了百分比显示,再次单击右键,在弹出的快捷菜单中选择【设置数据标签格式】。
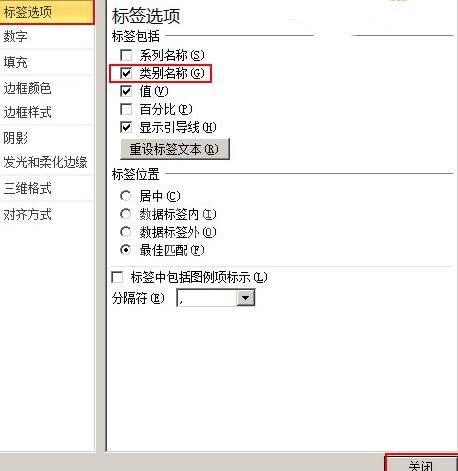
在弹出的对话框中切换到【标签选项】,勾选【类别名称】,完毕后单击【关闭】。
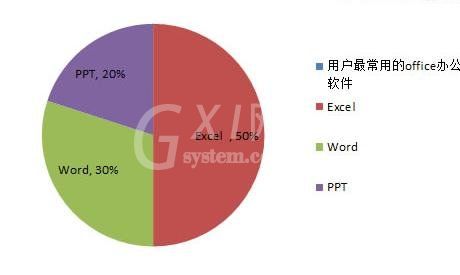
这样一个扇形统计图就制作好了。效果如图,在饼图中还有三维饼图,那种是用作有数据交叉的时候。
以上这里为各位分享了excel2010制作扇形图的操作教程。有需要的朋友赶快来看看本篇文章吧。


热门排行
今日推荐


热门手游
-
商场购物模拟器官方版

版本:v1.0.9
大小:46.11MB
日期:2024-12-16
-
滚动方块大冒险免费版

版本:v1.0.5
大小:26.10MB
日期:2024-12-16
-
恋恋奇缘体验服版

版本:v1.0.0
大小:131.33MB
日期:2024-12-16
-
炉石传说官方正版

版本:v1.0
大小:100.52MB
日期:2024-12-16
-
人群大师免费版

版本:v2.15.0
大小:57.68MB
日期:2024-12-16
-
方鸡跳跑单机版

版本:v1
大小:63.49MB
日期:2024-12-16